
Japanese / English
Automated CISH Quantification to determine the HER2 status of Breast Cancer Patients
Human epidermal growth factor receptor 2 (HER2) is a prognostic and predictive biomarker for many cancers such as colon, gastric and breast cancer [1]. Approximately 20% of breast cancer patients are HER2 positive due to HER2 gene amplification or subsequent HER2 protein overexpression. [2,3] HER2 amplification status is determined routinely for invasive breast cancer (IBC) patients to identify patients, suitable for giving targeted therapy such as trastuzumab. A HER2 positive patient benefits from the therapy but if such therapy is given to a HER2 negative patient, it may cause cardiac toxicity. Therefore, the selection of patients for giving such therapy is crucial.
Fluorescence in situ hybridization (FISH) and chromogenic in situ hybridization (CISH) are the FDA approved tests for assaying HER2 gene amplification. In practice, the assessment is performed by counting myriads of signals manually from FISH slides by pathologists. CISH is more advantageous than FISH. It is cheaper, easy to archive specimen, takes shorter time to prepare and allows simultaneous assessment of tissue morphology. However, existing automated CISH quantification methods fail to detect singular nuclei and reliable signals. We proposed an CISH quantification method to determine the HER2 status for IBC patients [Fig 1]. [4,5]
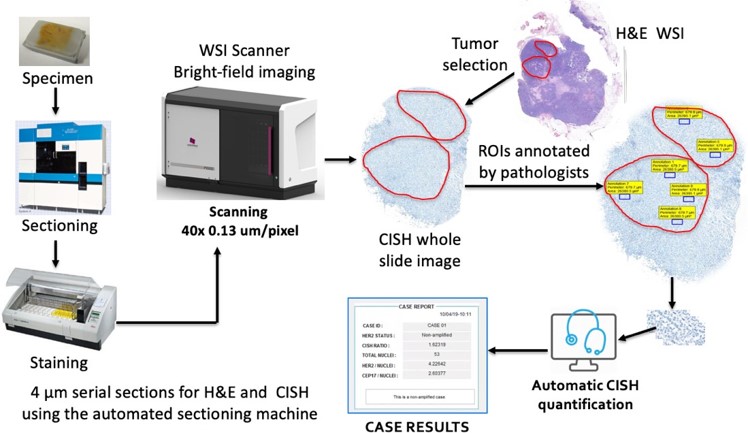
Fig 1 Workflow of proposed CISH quantification
This method selects a limited number of untruncated and nonoverlapped singular nuclei utilizing color unmixing and machine learning technique. It detects HER2 and chromosome enumeration probe 17 (CEP17) signals using RGB intensity. HER2 and CEP17 signals are scored based on the dye abundance to eliminate weak and false positives. Then, the HER2-to-CEP17 ratio and average HER2 copy are calculated for at least 20 nuclei with highest HER2-CEP17 difference to determine the HER2 status according to the ASCO/CAP 2018 guidelines.
Proposed method was compared with pathologist’s manual FISH and CISH counts for 22 IBC patients. The correlation coefficient between were higher than 0.98. Moreover, the p- values larger than 0.05 in t-tests and low-biases in Bland-Altman plots ensured that proposed method yields statistically indifferent results to replace the existing method. The method was established on two different WSI scanners. It reduced the labor and time for HER2 quantification.
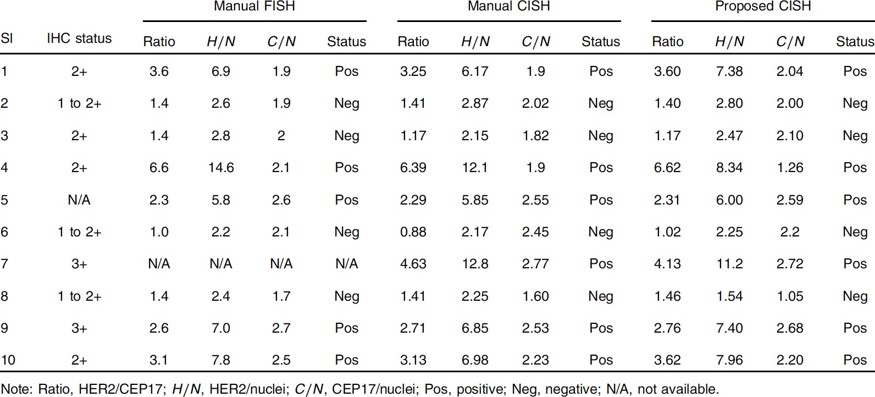
Table 1 Comparison of HER2 quantification and classification results
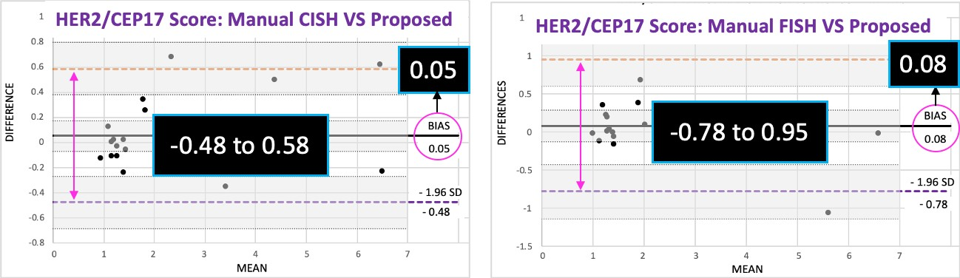
Fig. 2 Evaluation of proposed method using Bland–Altman plots
This is collaborative work between Memorial Sloan Kettering Cancer Center, USA, and Tokyo Institute of Technology, Japan.
References
- English DP, Roque DM, Santin AD. HER2 expression beyond breast cancer: therapeutic implications for gynecologic malignancies, Mol Diagn Ther. 2013; 17:85-99.
- Owens MA, Horten BC, Da Silva MM. HER2 amplification ratios by fluorescence in situ hybridization and correlation with immunohistochemistry in a cohort of 6556 breast cancer tissues, Clin Breast Cancer 2004; 5:63–69. PMID: 15140287
- Yaziji H, Goldstein LC, Barry TS, Werling R, Hwang H, Ellis GK et al. HER-2 testing in breast cancer using parallel tissue-based methods, Jama 2004; 291:1972–1977. PMID: 15113815
Publications
- Hossain M. Shakhawat, Matthew G. Hanna, Naohiro Uraoka, Tomoya Nakamura, Marcia Edelweiss, Edi Brogi, Meera R. Hameed, Masahiro Yamaguchi, Dara S. Ross, and Yukako Yagi. Automatic quantification of HER2 gene amplification in invasive breast cancer from chromogenic in situ hybridization whole slide images, Journal of Medical Imaging 6(4), 047501.
- Hossain M. Shakhawat, Tomoya Nakamura, Matthew Hanna, Noahiro Uraoka, Dara S. Ross, Meera R. Hameed, Masahiro Yamaguchi, Yukako Yagi. Assessment of HER2 amplification in invasive breast cancer from CISH using digital and computational pathology, Pathology Informatics Summit 2019, Pittsburgh, USA, May. 2019.